
Algorithm RAG Development Process and Model Performance Comparison
This continues from the previous post.
Architecture
This is the overall flow I originally had in mind.

Before jumping into full development, I decided to compare embedding models as a study exercise.
It took more time than expected, and I am not fully sure whether my analysis is correct, so I plan to ask the community for validation. If you read this post, feedback would be very appreciated.
Data Acquisition and Preprocessing
-
LeetCode: The full problem set as of 2025, around 3,500+ problems, collected through the LeetCode GraphQL API.
-
Baekjoon: solved.ac API and web crawling.
I collected 100 examples from each source. To maximize embedding performance, the collected data went through the following preprocessing steps.
-
HTML and noise removal: Cleaned HTML tags and unnecessary narrative expressions.
-
Search-optimized text construction: Combined Title, Tags, and Content to create an
embedding_textfield so the model could clearly recognize category and constraints. -
Logical Skeleton: AI really likes this phrase. I used an LLM to create a
logical_skeletonfield summarizing the core algorithmic logic. Because Baekjoon is Korean-based, the content was translated into English.
1. Data Collection
   ├─ baekjoon_data_collection.py  → baekjoon_raw_data.jsonl (100 items)
   └─ leetcode_data_collection.py  → leetcode_raw_data.jsonl (100 items)

2. Preprocessing
   ├─ preprocess.py                → *_preprocessed.jsonl
   │  └─ Remove HTML/Markdown, extract core logic
   └─ refine_leetcode.py           → leetcode_refined.jsonl
      └─ LLM-based Logical Skeleton extraction

3. Normalization
   ├─ improve_recall.py            → baekjoon_refined.jsonl
   │  └─ Convert Baekjoon data into English logical skeletons
   └─ data_normal.py               → baekjoon_normalized.jsonl
      └─ Remove prefix "Logical Skeleton: " -> convert to "embedding_text"

4. Ground Truth Creation
   ├─ ground_truth_finder.py       → potential_gt.json
   │  └─ Automatically extract candidate pairs with an LLM and review them
   └─ leetcode_match_pgt.py        → ground_truth_v2.json
      └─ Complete 100 BJ-LC ground-truth pairs

5. Model Benchmarking
   ├─ evaluate_model.py            → OpenAI text-embedding-3-small
   ├─ evalute_model_ver2.py        → Jina-v3 (1024 dim)
   └─ evalute_model_ver3.py        → BGE-M3 (Local)
      └─ Measure Recall@K and MRR
Why Only 100?
Because I built 100 ground-truth pairs, I randomly sampled 100 examples for the experiment. I think this is usually called a Golden Set. It apparently needs to be mapped by a human.
Embedding Model Benchmark
To build a more precise knowledge mapping, I ran a pilot test on three main embedding models.
Models compared: Jina v3, OpenAI text-embedding-3-small, BGE-M3.
Evaluation Metrics
- Recall@K: The percentage of cases where the correct answer appears within the top K results.
- MRR (Mean Reciprocal Rank): The average reciprocal rank of the correct answer.
Benchmark Results (100-Set Golden Set)
| Model | Recall@1 | Recall@5 | Recall@10 | MRR |
|---|---|---|---|---|
| OpenAI-v3 (small) | 0.22 | 0.50 | 0.65 | 0.354 |
| Jina-v3 (1024 dim) | 0.17 | 0.47 | 0.63 | 0.319 |
| BGE-M3 (Local) | 0.15 | 0.40 | 0.53 | 0.272 |
OpenAI-v3 (small) showed the best performance.
Recall@10: It finds the correct candidate within the top 10 fairly well, but Recall@1: the rate of placing the correct answer first is relatively low at 22%.
It Would Have Been Nice to Stop Here…
Even after seeing these results, something felt uncomfortable. I had produced three datasets, [Raw, Preprocessed, Refined], but I was not sure whether that was enough.
So I decided to analyze the whole process and ran additional experiments.
The data was stored as .jsonl.
[1] Text Statistics: Length, TTR, noise ratio, keyword density
[2] Embedding Quality: Intra/inter-cluster distances, Silhouette Score
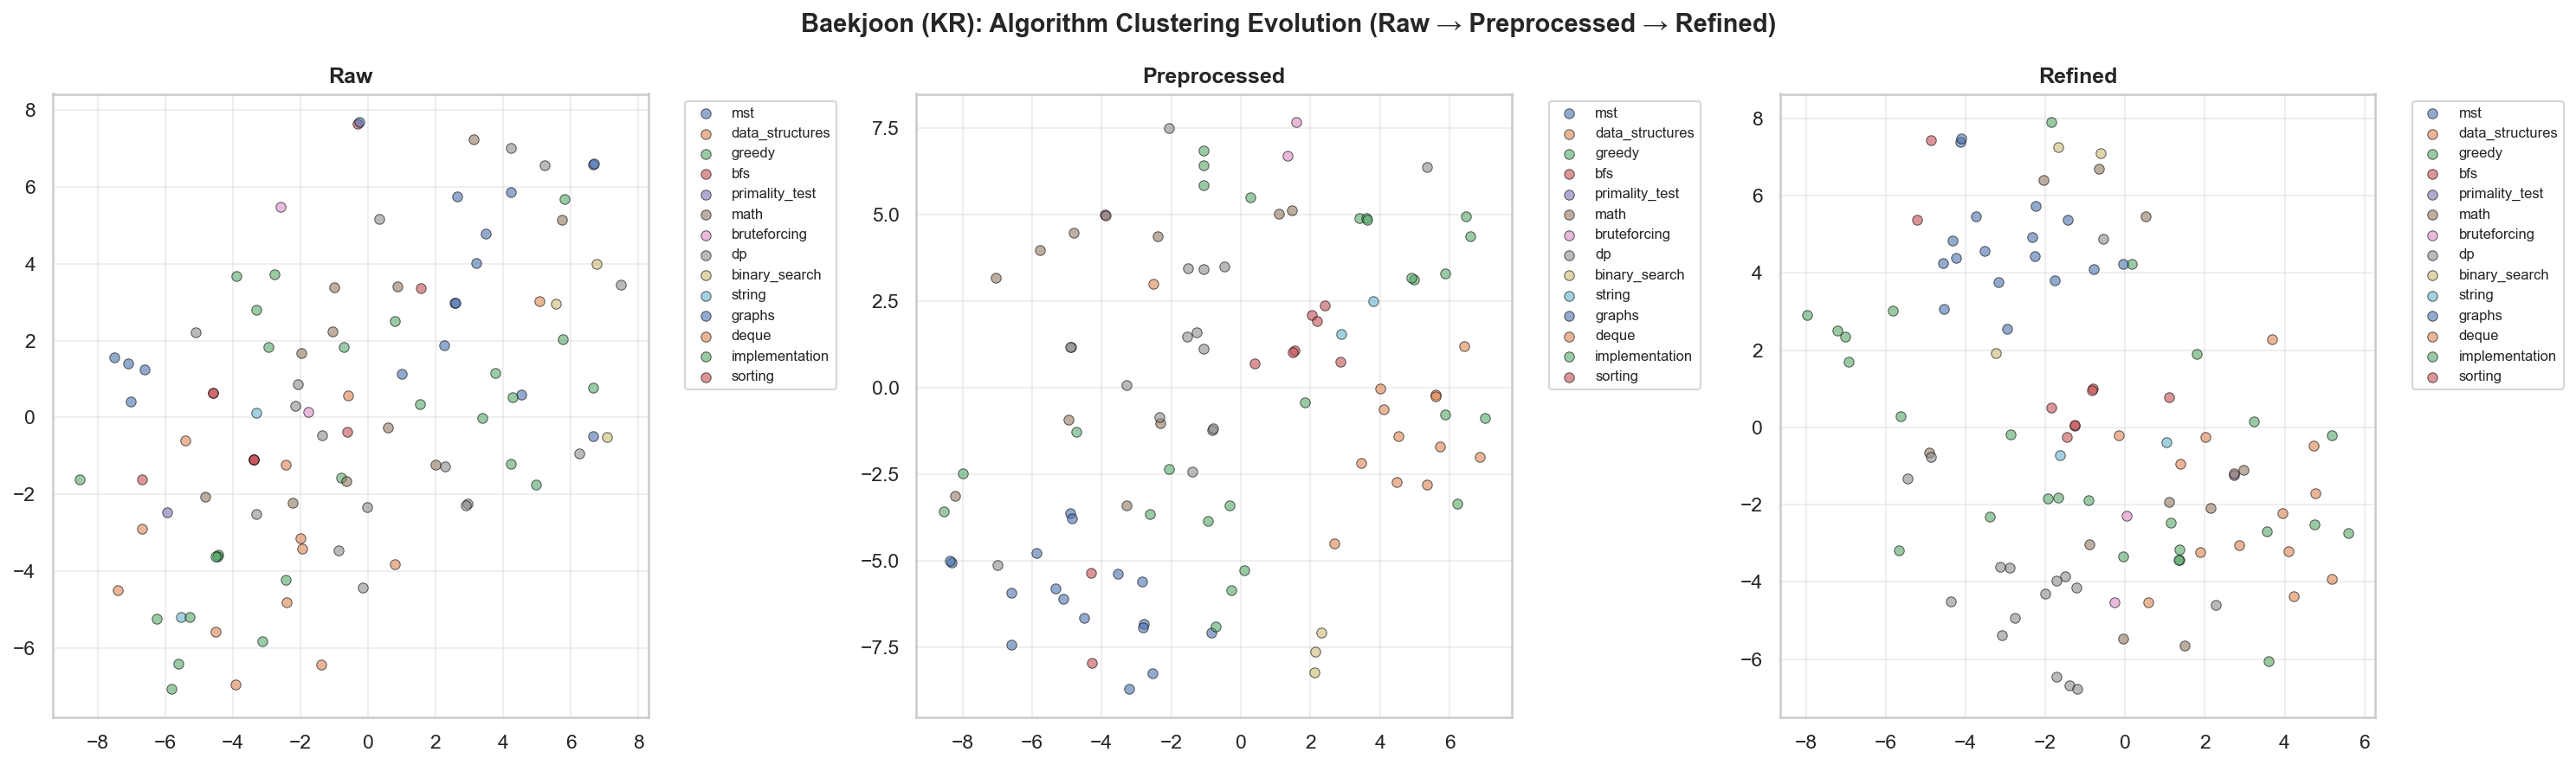
[3] t-SNE & UMAP
[4] Cross-lingual Alignment: KR <-> EN
[1] Text Statistics
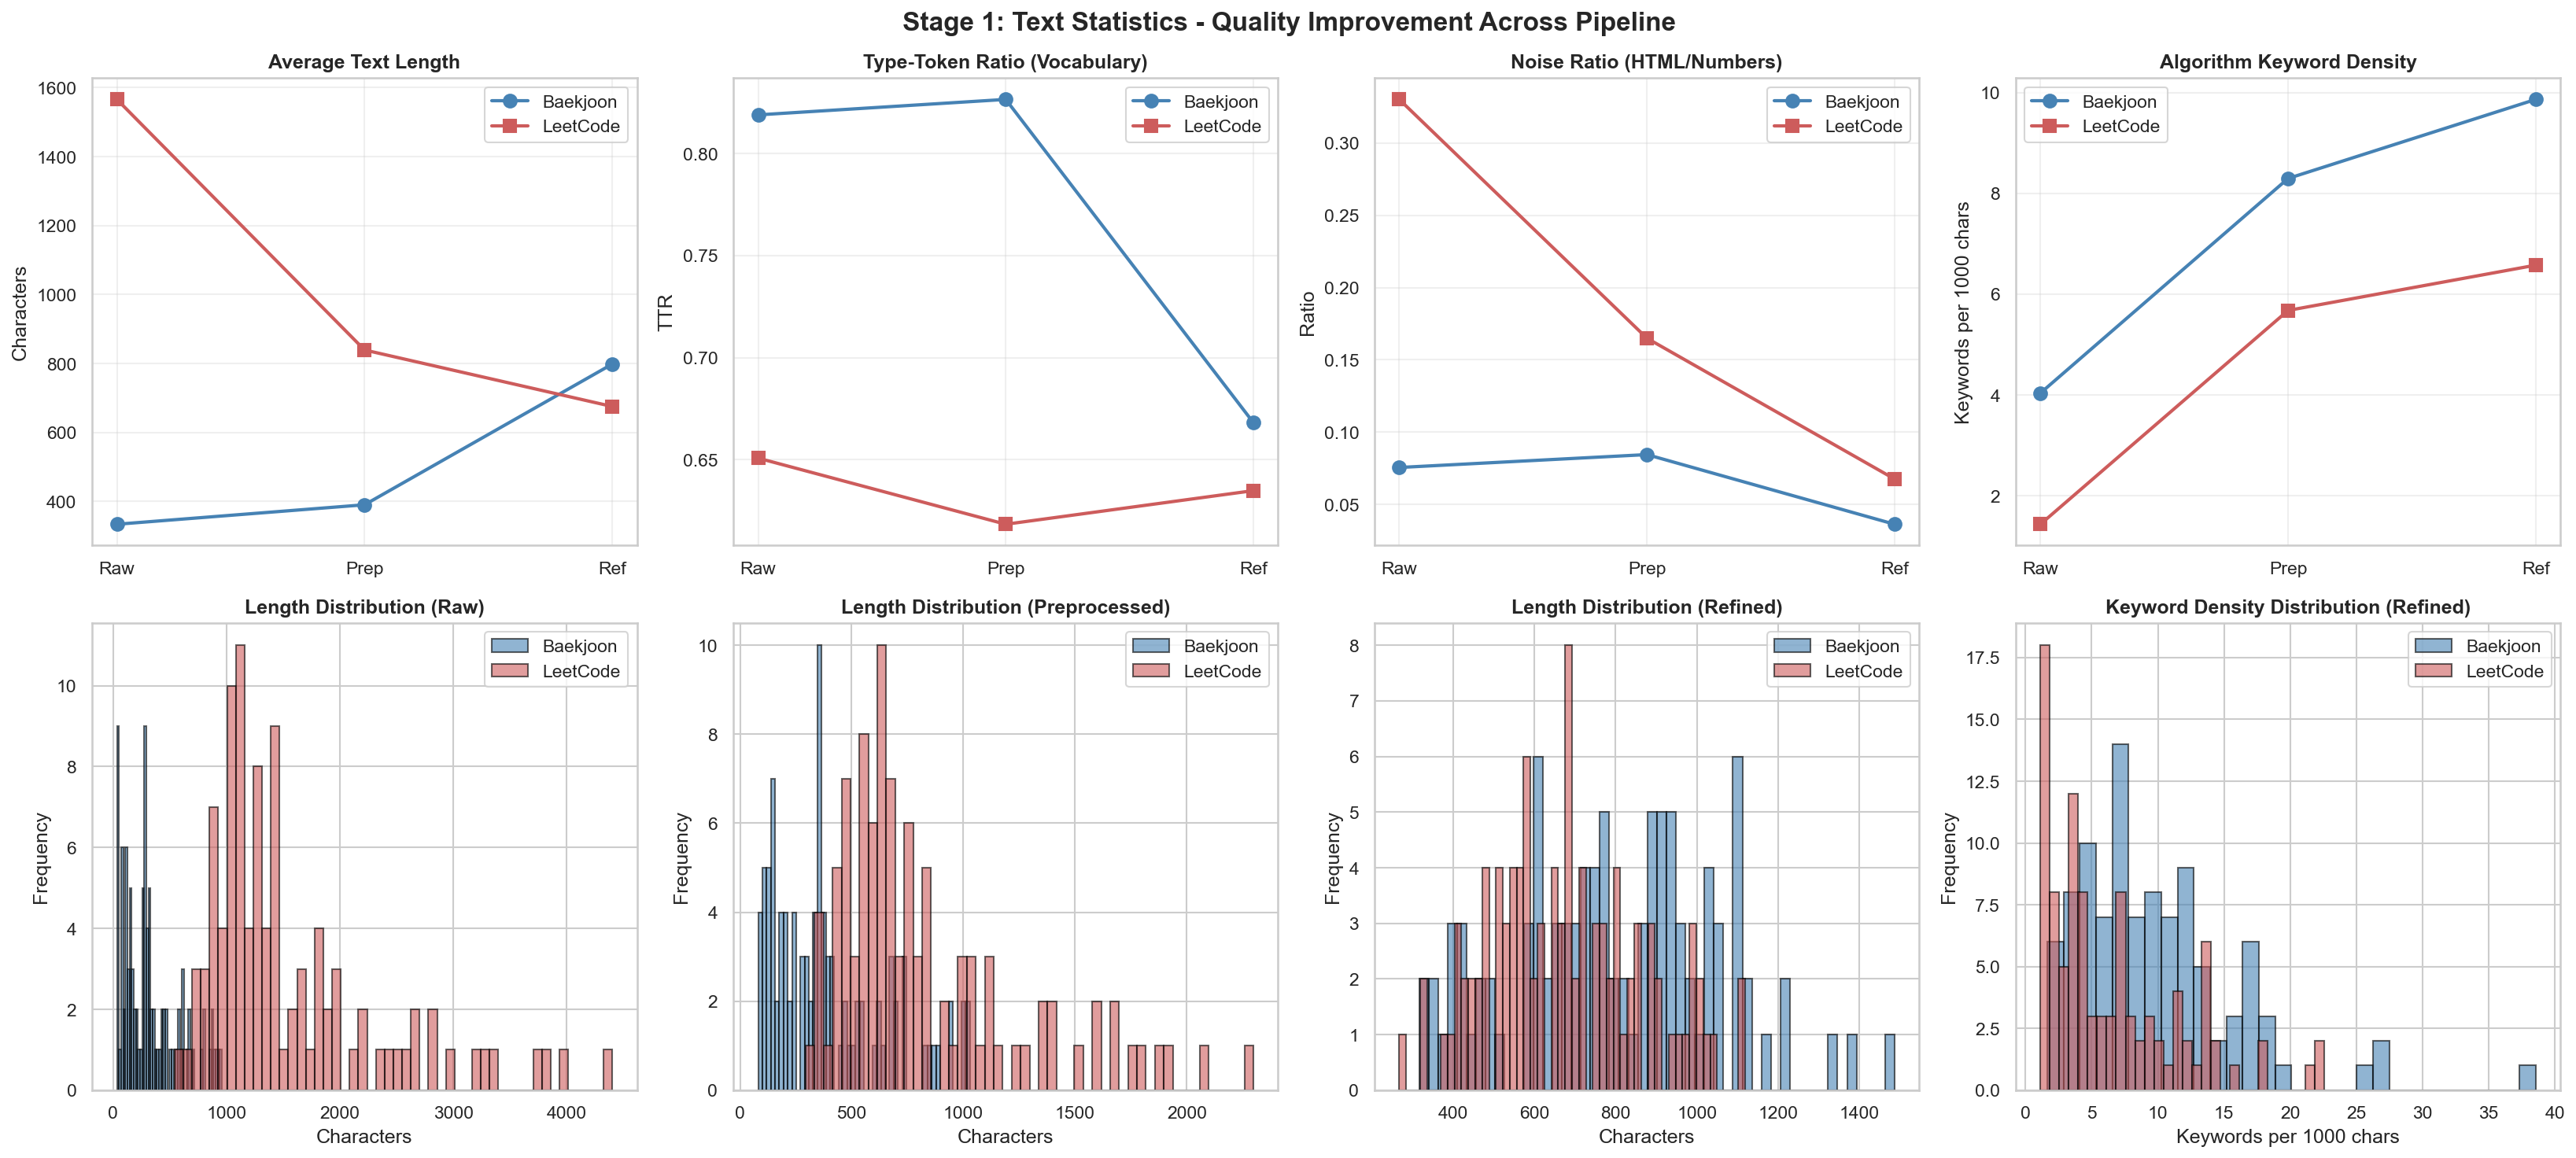
Why is there a difference in the HTML noise section? For LeetCode, I used logic that pulls the data directly through the GraphQL API:
{"id": "14", "title": "Longest Common Prefix", "titleSlug": "longest-common-prefix", "difficulty": "Easy", "content": "<p>Write a function to find the longest common prefix string amongst an array of strings.</p>\n\n<p>If there is no common prefix, return an empty string <code>""</code>.</p>\n\n<p>&n"}For Baekjoon, I pulled the data through the solved.ac API:
{"id": "9251", "title": "LCS", "difficulty": 11, "tags": ["dp", "string", "lcs"], "content": "LCS(Longest Common Subsequence, 최장 공통 부분 수열)문제는 두 수열이 주어졌을 때, 모두의 부분 수열이 되는 수열 중 가장 긴 것을 찾는 문제이다.예를 들어, ACAYKP와 CAPCAK의 LCS는..."}Because Baekjoon has almost no HTML tags, the noise ratio seems to be lower. I suspect that when I ran the same preprocessing code, the Baekjoon data improved slightly for that reason.
[2] Embedding Quality
I generated embeddings for each file with Jina-v3 and OpenAI-v3 (small). The usage cost was not significant.
BAEKJOON DATASETS:
  Raw:         100 items | Fields: ['id', 'title', 'difficulty', 'tags', 'content', 'embedding', 'embedding_model', 'embedding_dim', 'embedding_jina', 'embedding_jina_model', 'embedding_jina_dim', 'embedding_openai', 'embedding_openai_model', 'embedding_openai_dim']
  Preprocessed: 100 items | Fields: ['id', 'title', 'difficulty', 'tags', 'content', 'content_cleaned', 'embedding_text', 'embedding', 'embedding_model', 'embedding_dim', 'embedding_jina', 'embedding_jina_model', 'embedding_jina_dim', 'embedding_openai', 'embedding_openai_model', 'embedding_openai_dim']
  Refined:      100 items | Fields: ['id', 'title', 'difficulty', 'tags', 'content', 'content_cleaned', 'embedding_text', 'embedding', 'embedding_model', 'embedding_dim', 'embedding_jina', 'embedding_jina_model', 'embedding_jina_dim', 'embedding_openai', 'embedding_openai_model', 'embedding_openai_dim']

LEETCODE DATASETS:
  Raw:         100 items | Fields: ['id', 'title', 'titleSlug', 'difficulty', 'content', 'tags', 'embedding', 'embedding_model', 'embedding_dim', 'embedding_jina', 'embedding_jina_model', 'embedding_jina_dim', 'embedding_openai', 'embedding_openai_model', 'embedding_openai_dim']
  Preprocessed: 100 items | Fields: ['id', 'title', 'titleSlug', 'difficulty', 'content', 'tags', 'content_cleaned', 'embedding_text', 'embedding', 'embedding_model', 'embedding_dim', 'embedding_jina', 'embedding_jina_model', 'embedding_jina_dim', 'embedding_openai', 'embedding_openai_model', 'embedding_openai_dim']
  Refined:      100 items | Fields: ['id', 'title', 'titleSlug', 'difficulty', 'content', 'tags', 'content_cleaned', 'embedding_text', 'embedding', 'embedding_model', 'embedding_dim', 'embedding_jina', 'embedding_jina_model', 'embedding_jina_dim', 'embedding_openai', 'embedding_openai_model', 'embedding_openai_dim']
Silhouette Score
This is one way to check whether data has been grouped well when using clustering algorithms such as K-Means.
It has values from -1 to 1. Because the goal of my program is to match Baekjoon problems to LeetCode problems well, the desired situation is for the distance between Baekjoon problems, , to be greater than the distance between a Baekjoon problem and a LeetCode problem, . So in this setup, a negative value is good.
- (Intra-cluster distance): The average distance to other data points in the same cluster.
- (Inter-cluster distance): The average distance to the nearest cluster that the point does not belong to.
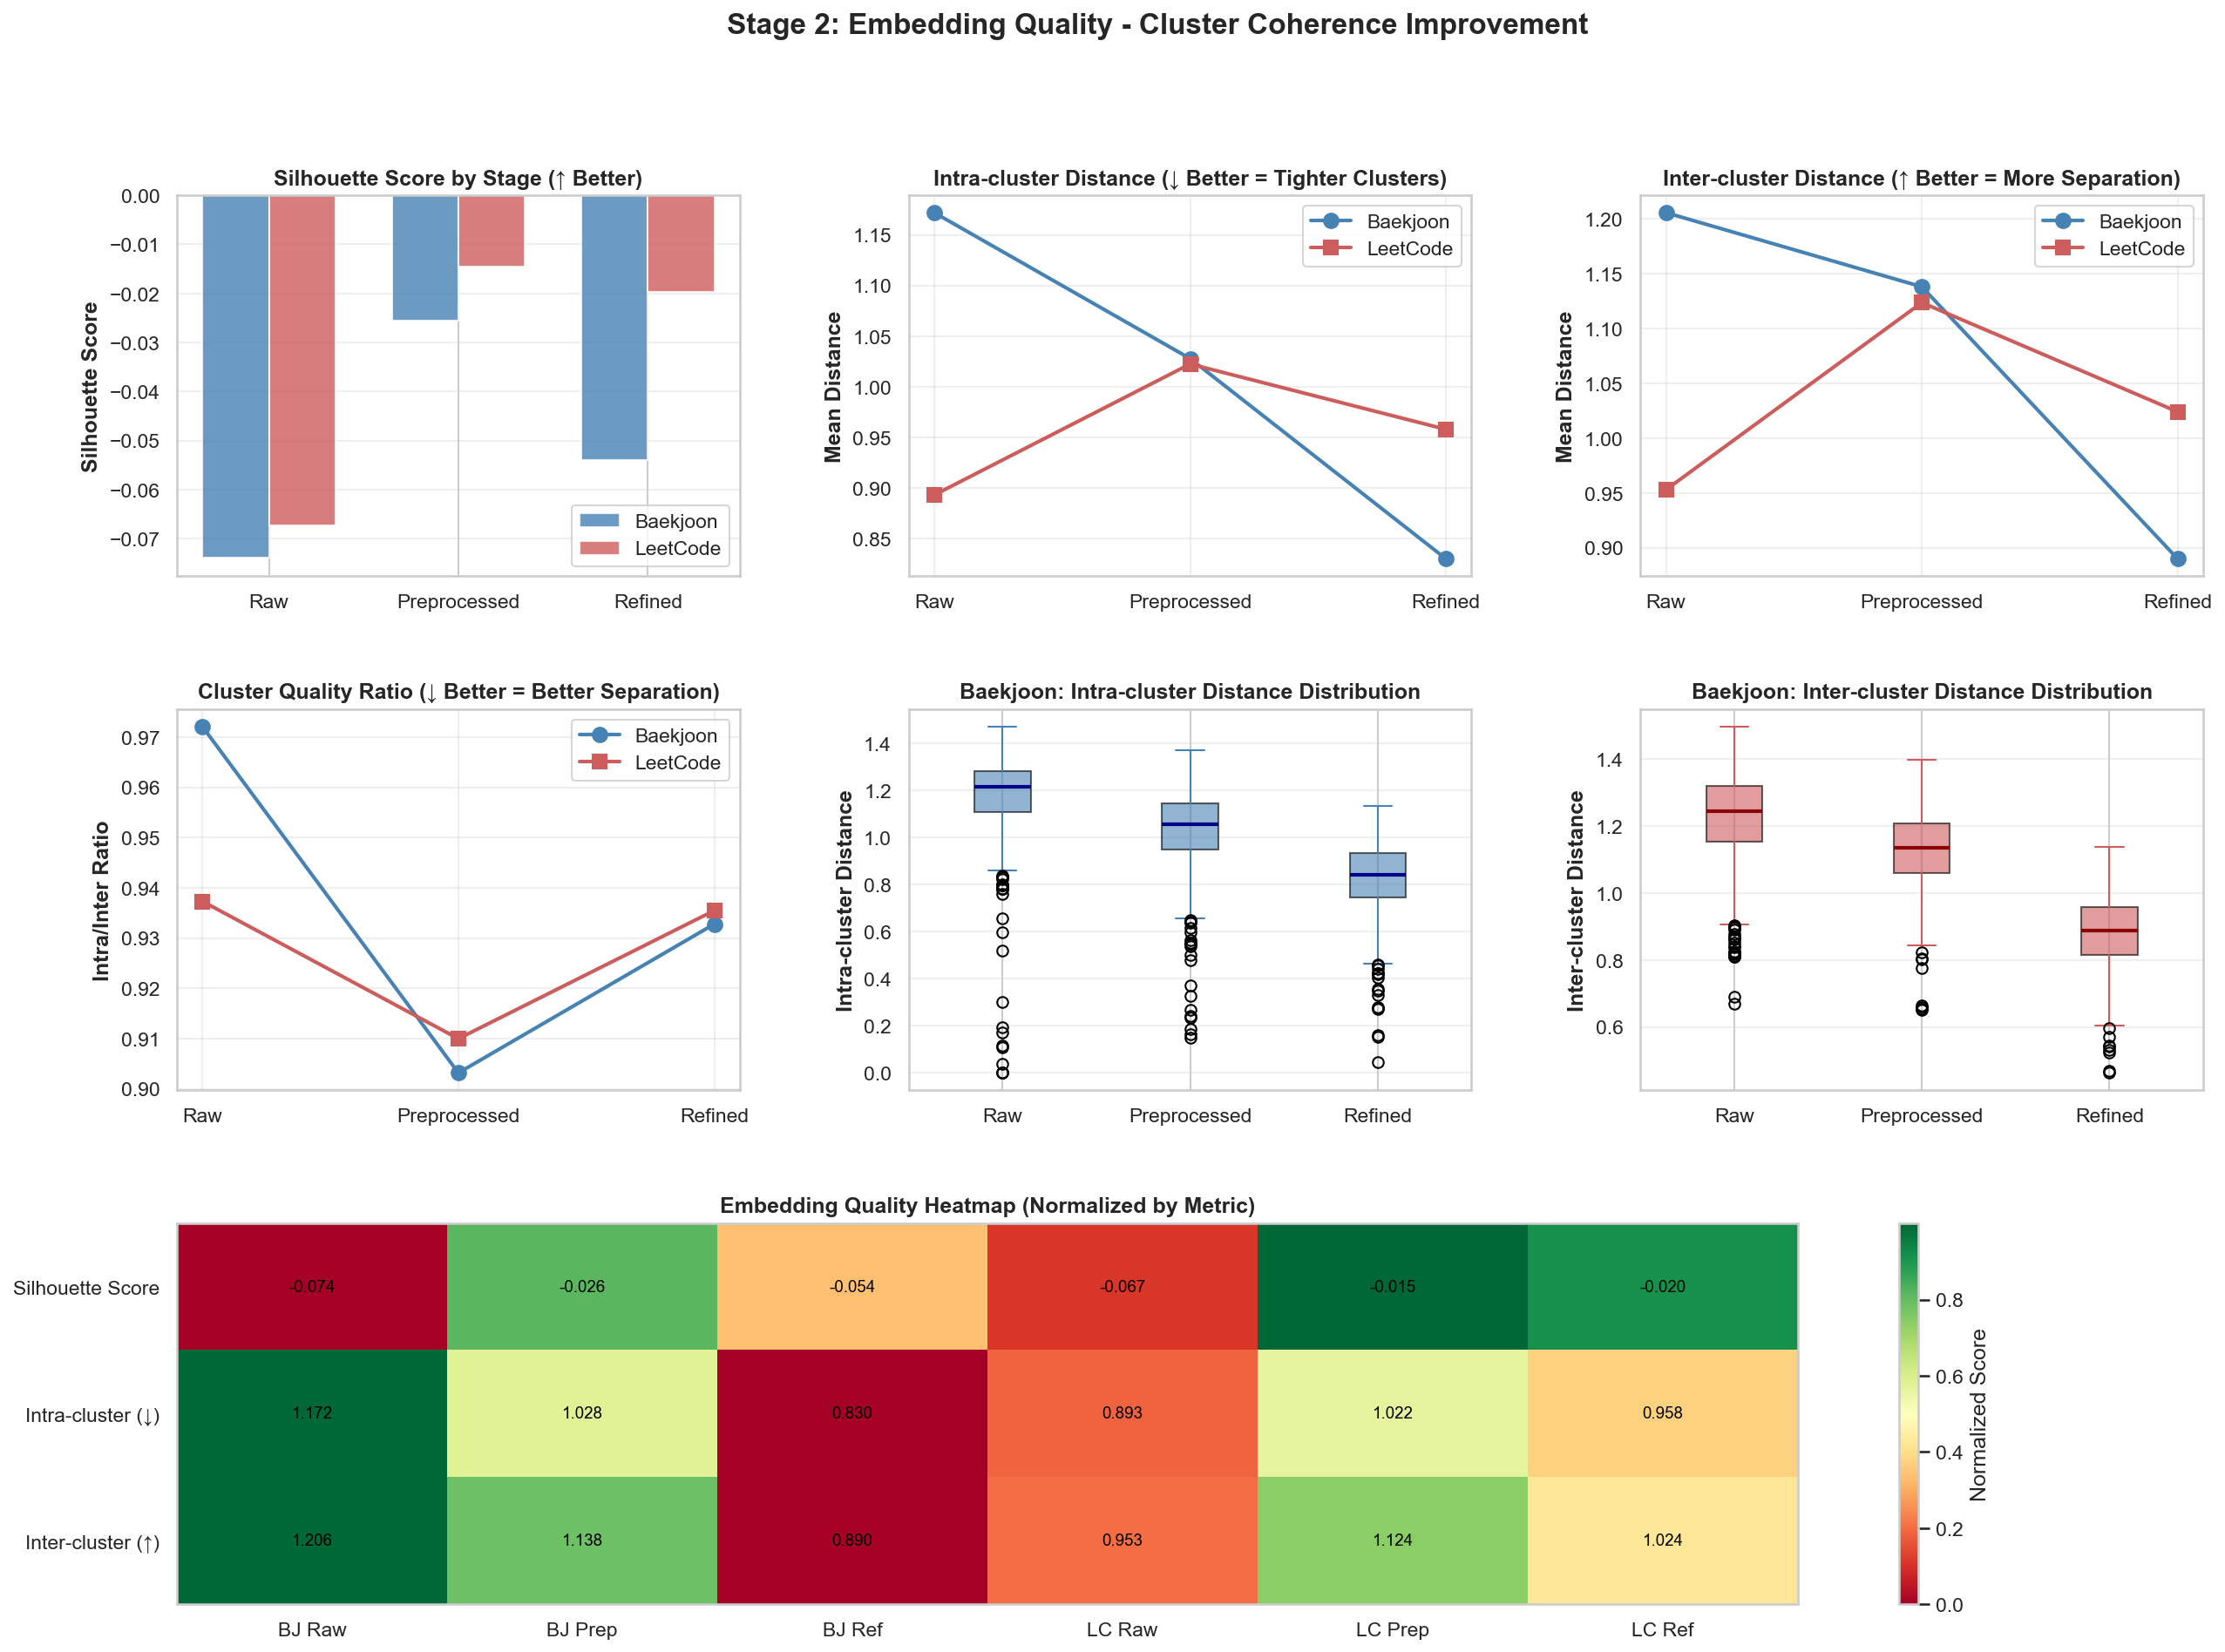
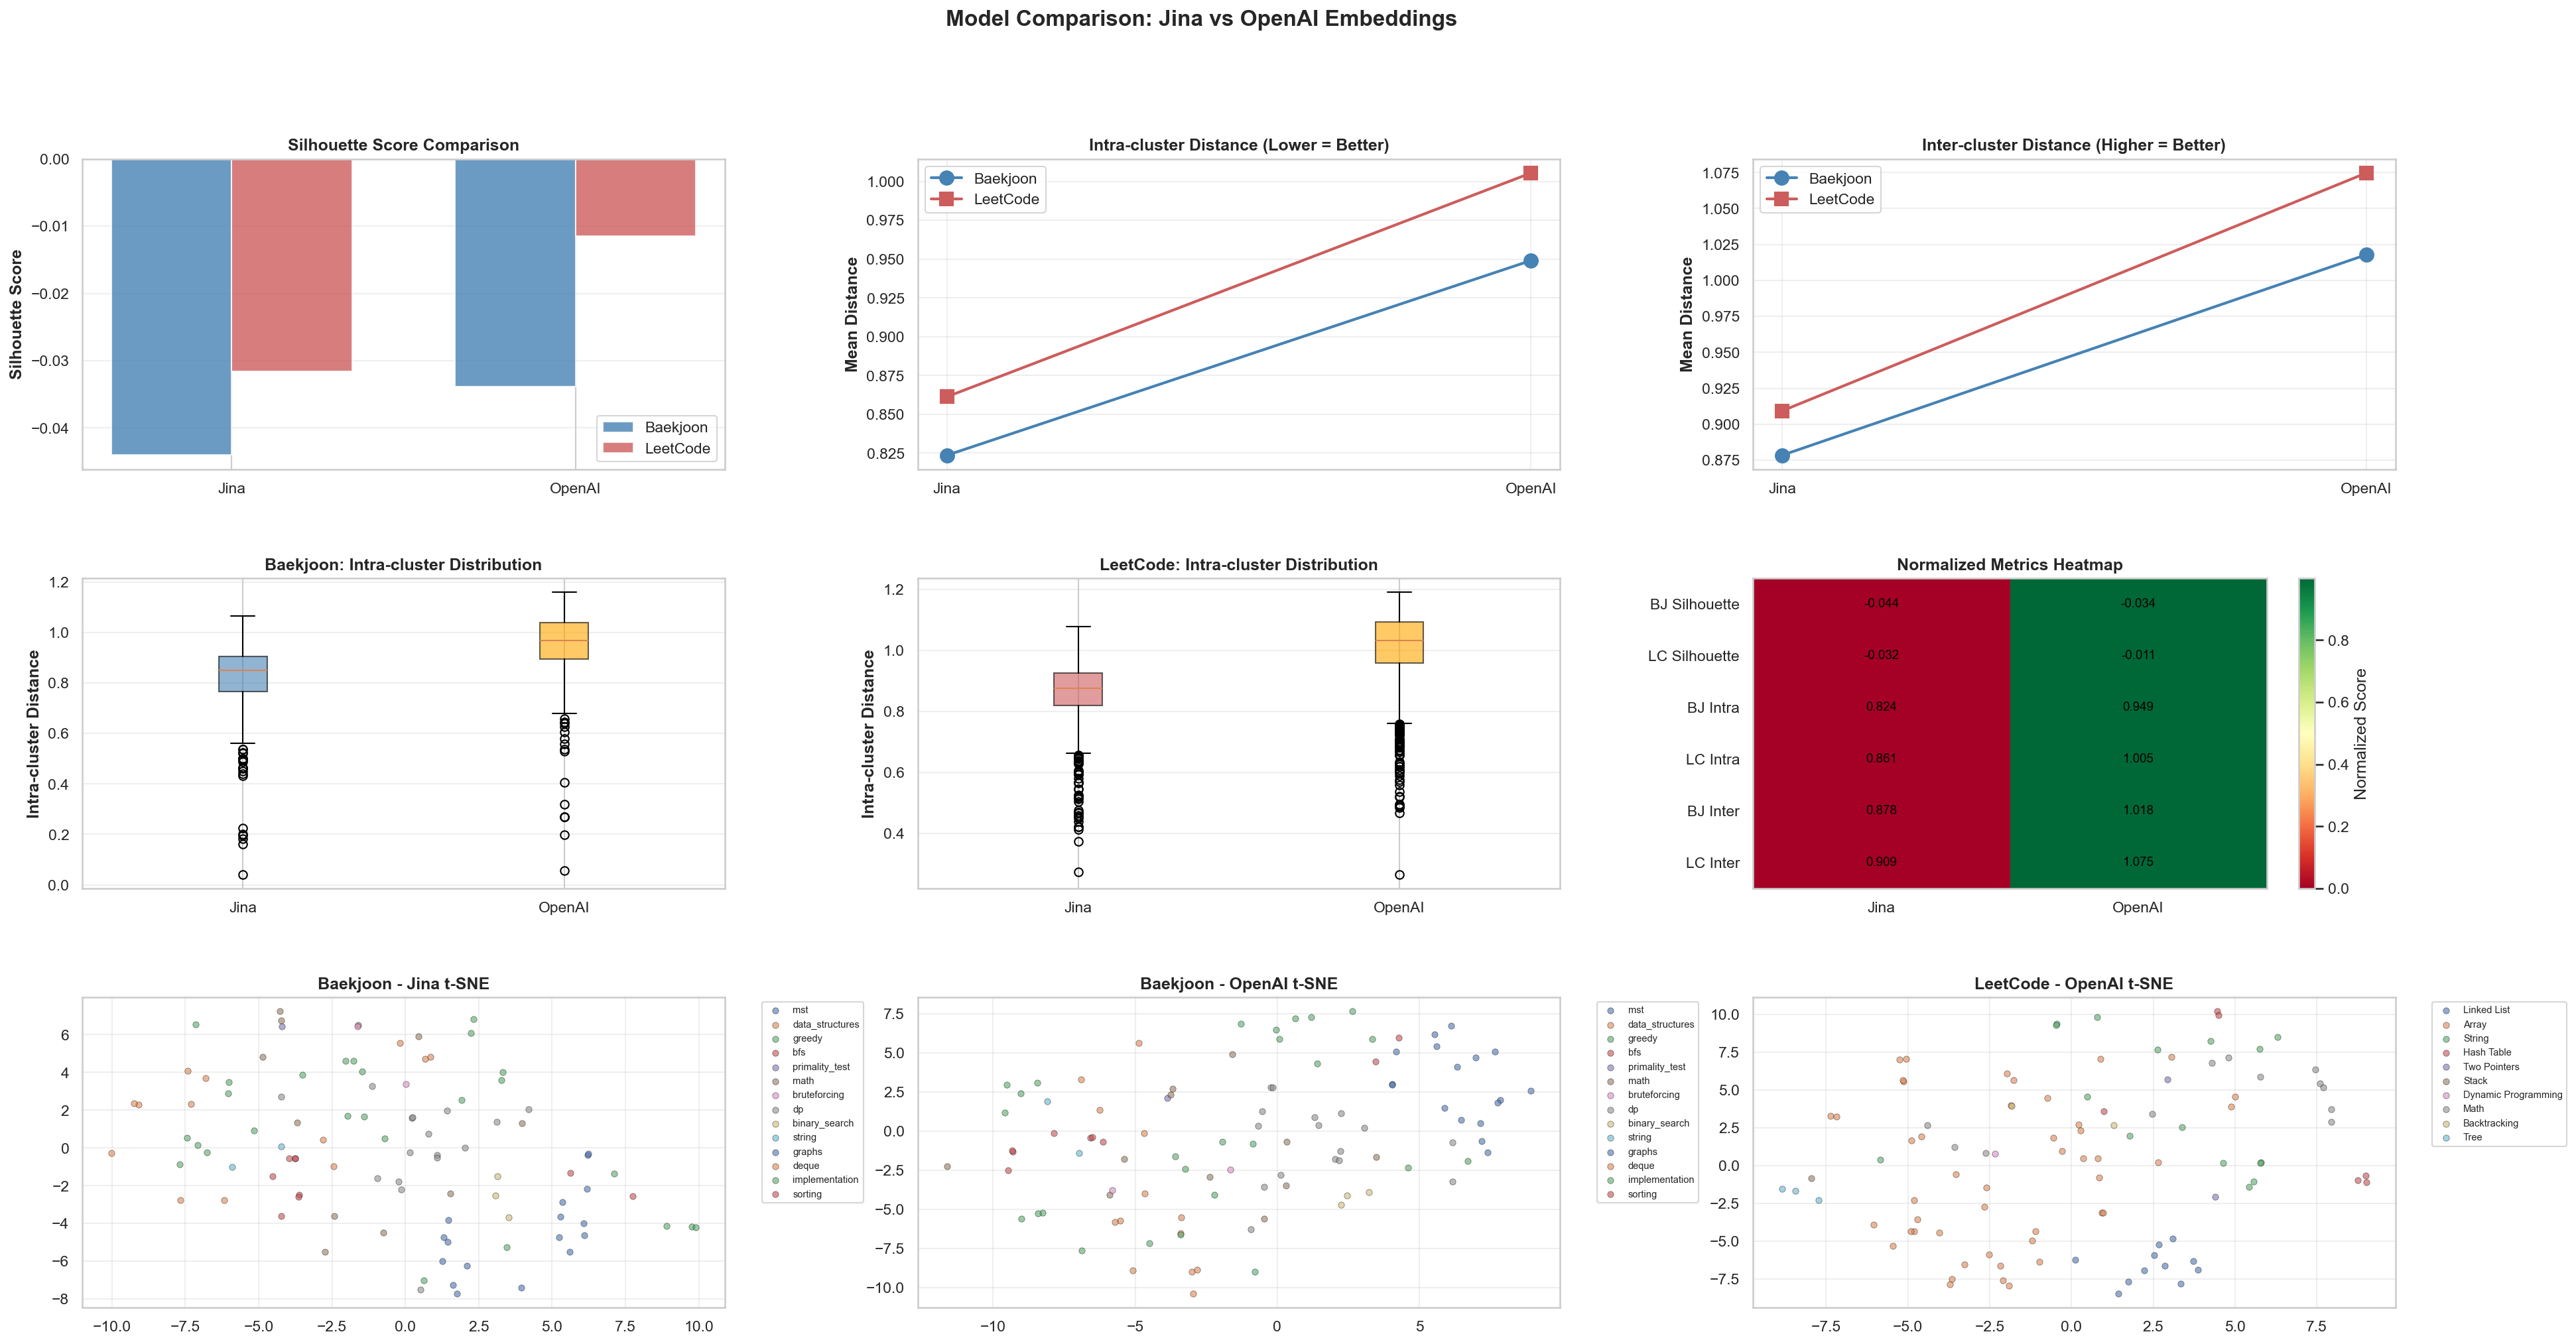
1. Silhouette Score
The largest improvement happened when moving from Raw to Preprocessed. The score decreased again when moving to Refined. This suggests that preprocessing had the biggest effect on embedding quality.
2. Intra-cluster Distance
This measures how close data points inside the same cluster are. Lower values mean problems in the same category are tightly gathered in vector space.
For Baekjoon, shown in blue, the distance decreases sharply from Raw to Refined. This means the refinement process gave Baekjoon problems more consistent vector representations. LeetCode, on the other hand, peaks at the Preprocessed stage and then decreases again.
3. Inter-cluster Distance
This measures the distance between different clusters, such as the Baekjoon group and the LeetCode group. Higher values mean the two groups are more clearly separated.
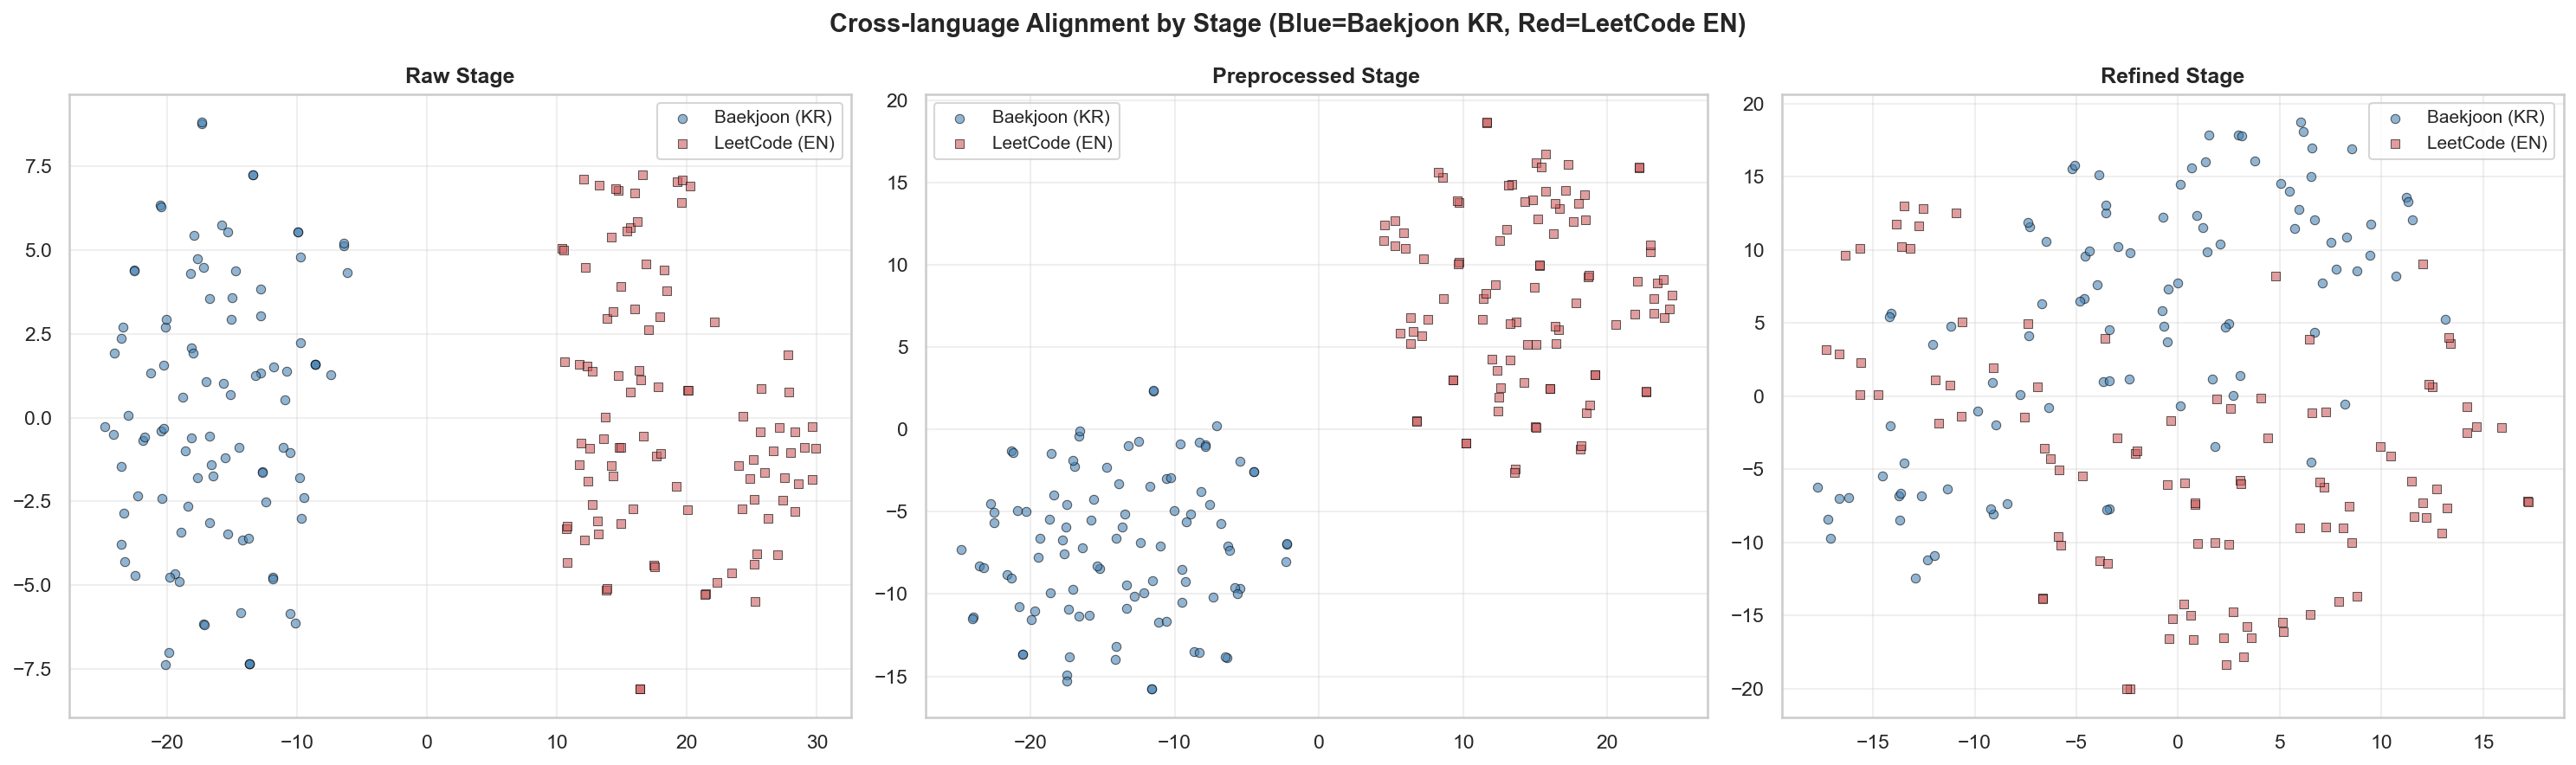
For Baekjoon, the distance actually decreases as stages progress. This suggests the Baekjoon data is moving closer to the vector region of the LeetCode data. In other words, I interpret it as the semantic distance between the two platforms becoming smaller.
4. Cluster Quality Ratio (Intra/Inter Ratio)
This is the ratio of intra-cluster distance to inter-cluster distance. Lower is better.
Both datasets reach their lowest point, meaning best quality, at the Preprocessed stage. The slight increase after the Refined stage suggests that excessive refinement may have diluted some unique features of the data.
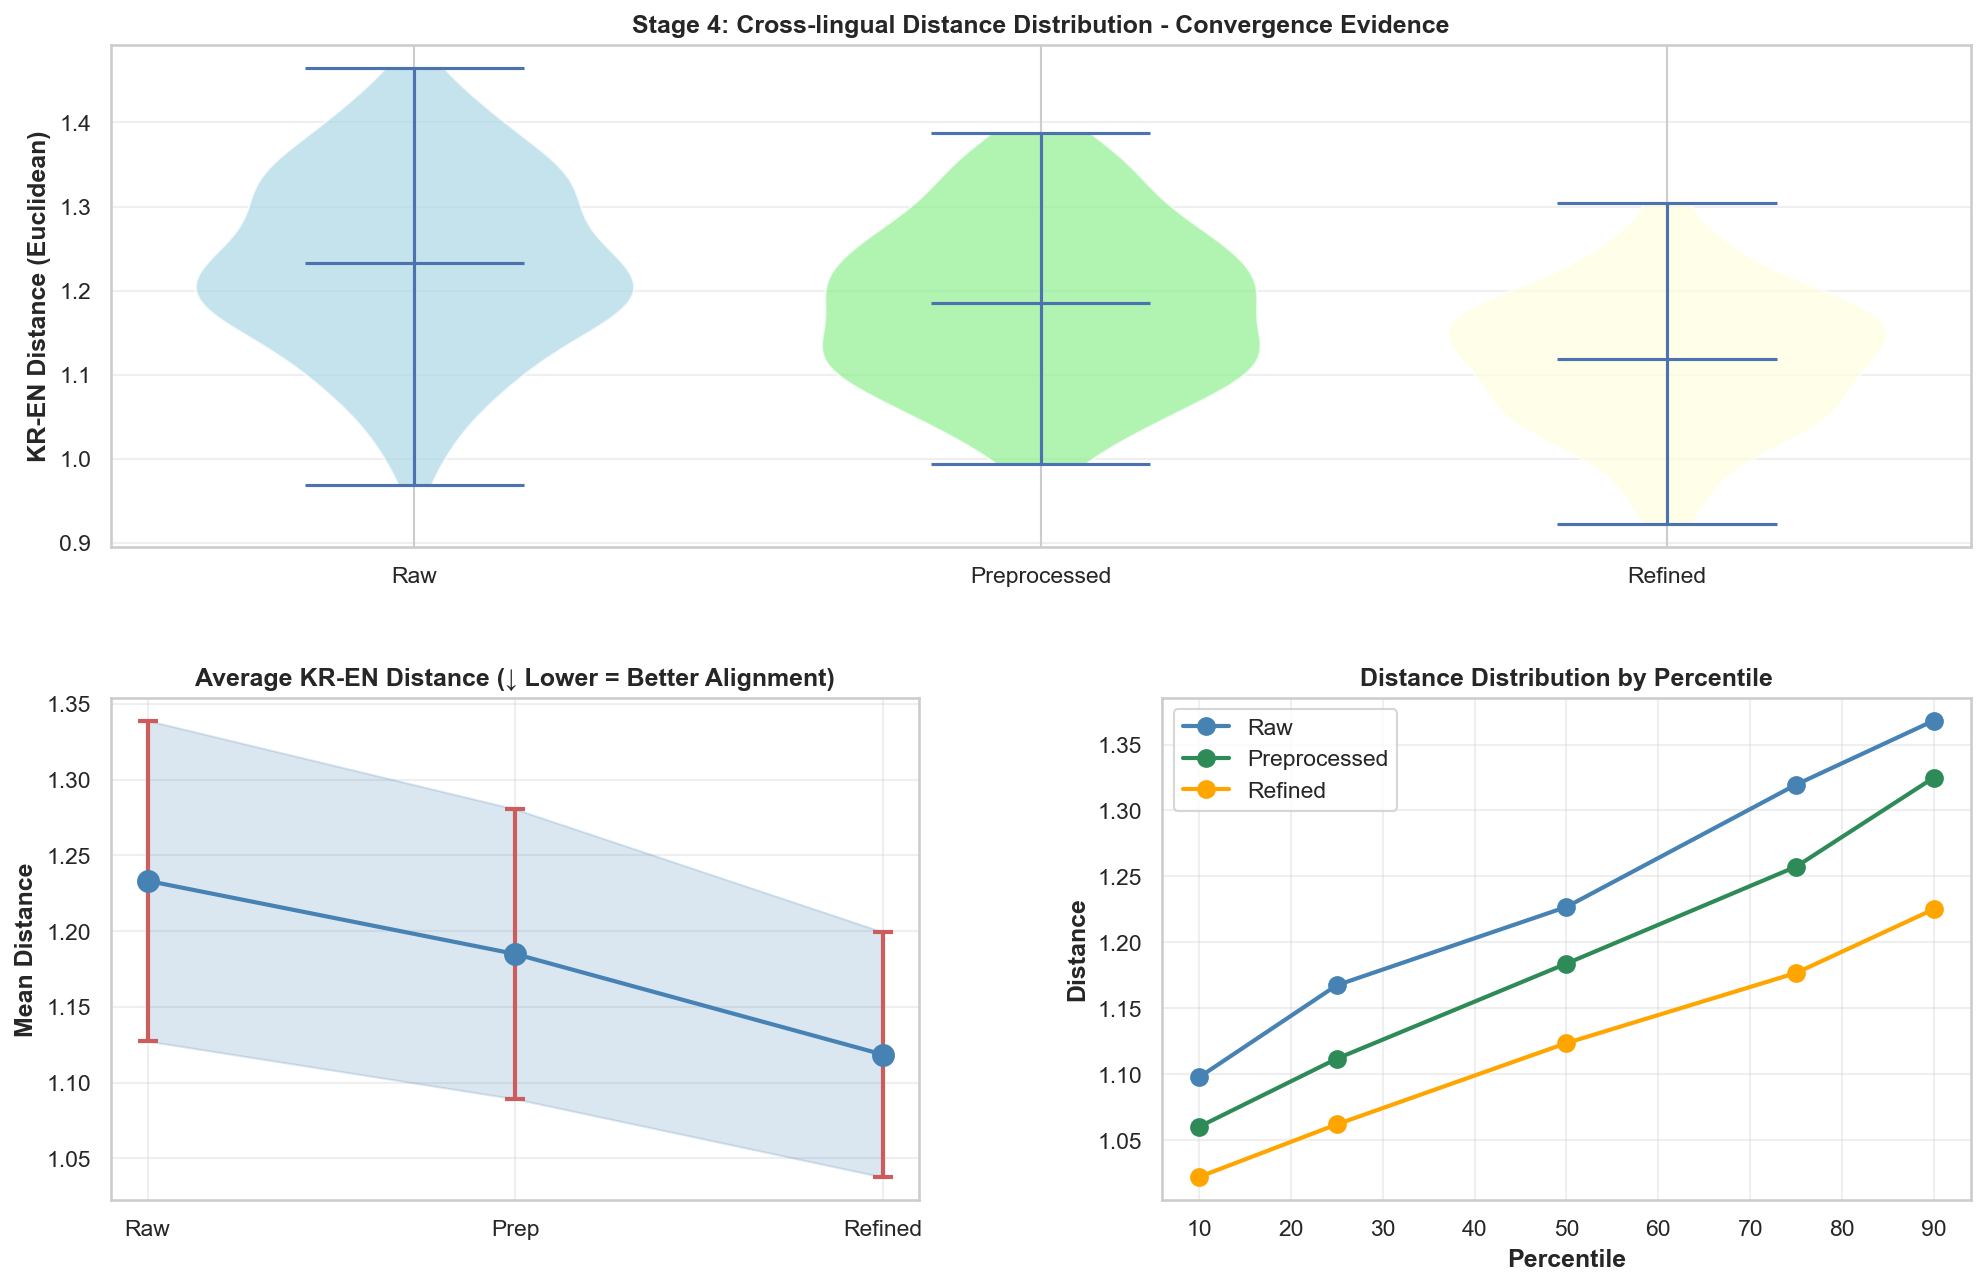
5. Distance Distribution (Box Plots)
This visualizes the distance distribution of Baekjoon data. It shows the median, the line inside the box, and the spread of the data.
Intra-cluster: As the stages progress, the box height gets lower and moves downward. This means the data is becoming evenly dense without extreme outliers.
Inter-cluster: The distance distribution to external data also stabilizes downward and moves into a range where comparison with the other dataset becomes possible.
6. Embedding Quality Heatmap
This table visualizes all metrics together. The closer a cell is to green, the better the performance for that metric.
The BJ Prep and LC Prep columns have the highest share of green.
As a result, for the current dataset, I can make the statistical conclusion that embeddings in the Preprocessed state have the highest retrieval efficiency.
Given this result, I checked what might have gone wrong in the Refined stage.
As expected, the issue seems to be that the Baekjoon dataset’s embedding_text was replaced with a Logical Skeleton, the phrase AI had emphasized so strongly. This may have been harmful, and because it differed from the LeetCode data format, the two datasets may have moved farther apart in vector space.
Solution: Algorithm Devlog 04
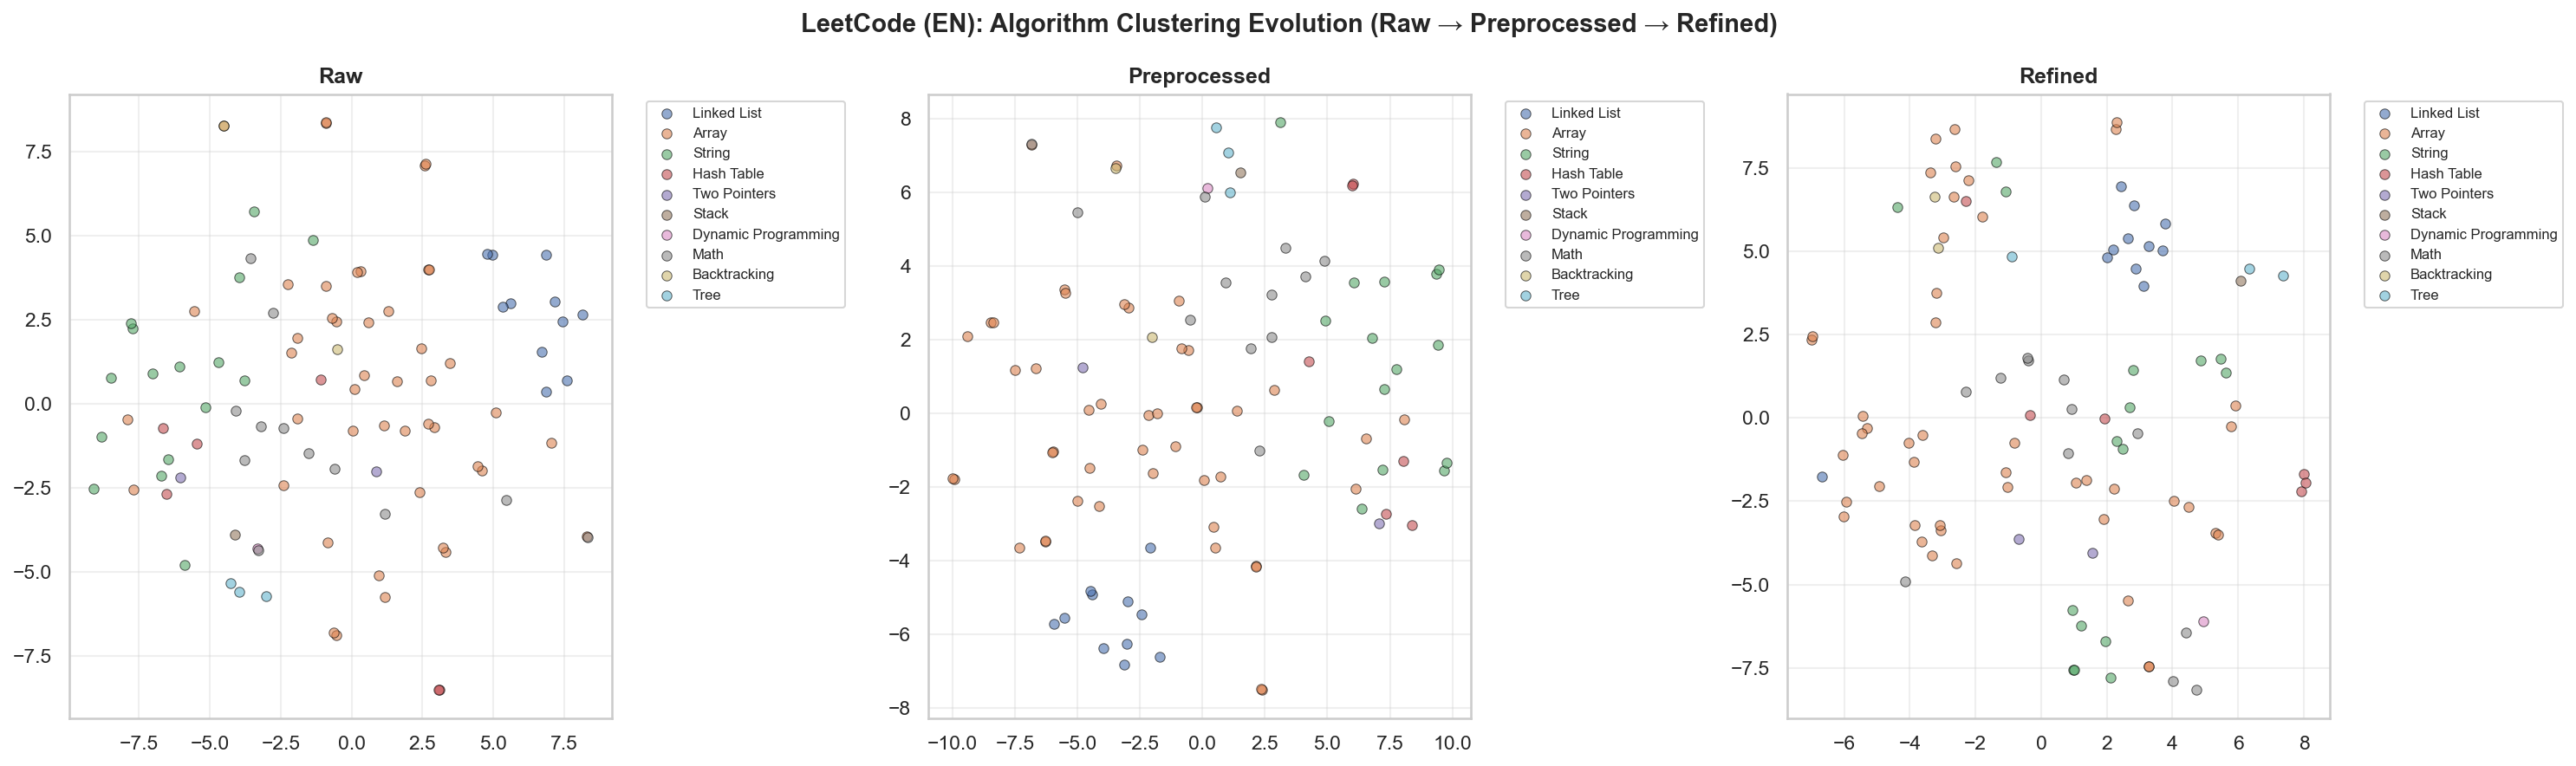
[3] t-SNE & UMAP
Baekjoon Problem t-SNE Visualization
LeetCode Problem t-SNE Visualization
Korean -> English Preprocessing Flow
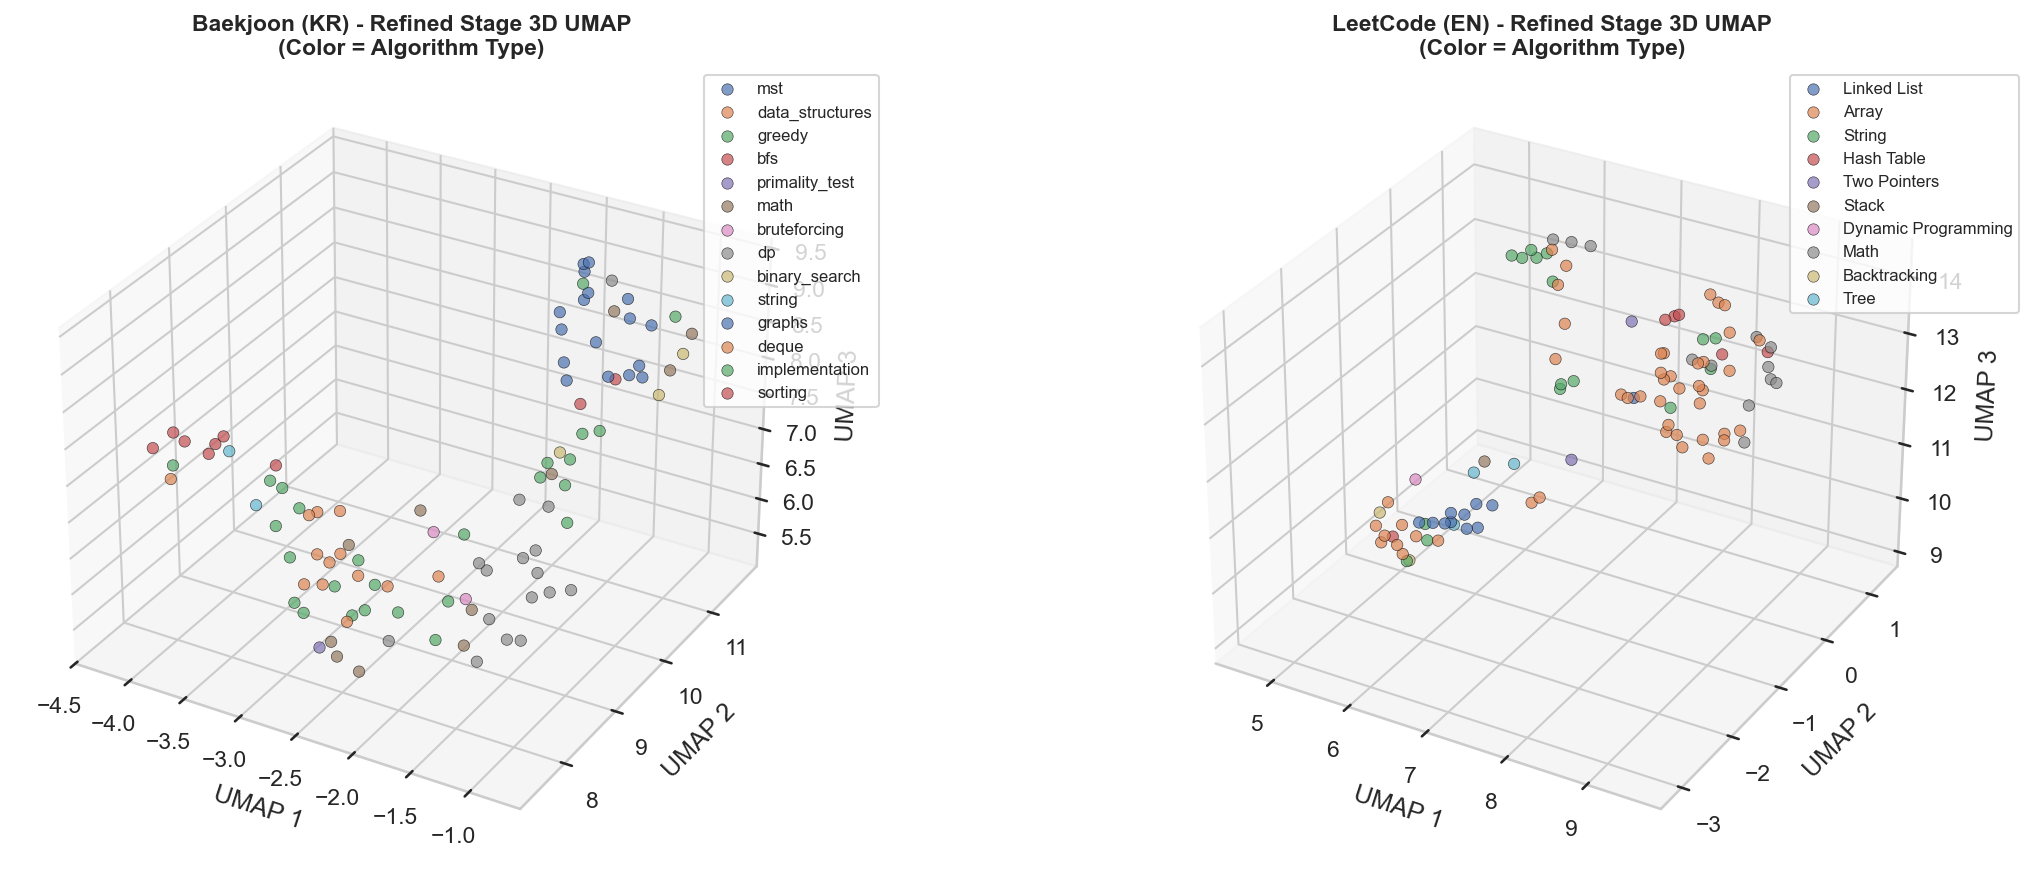
UMAP Visualization (Refined Dataset)
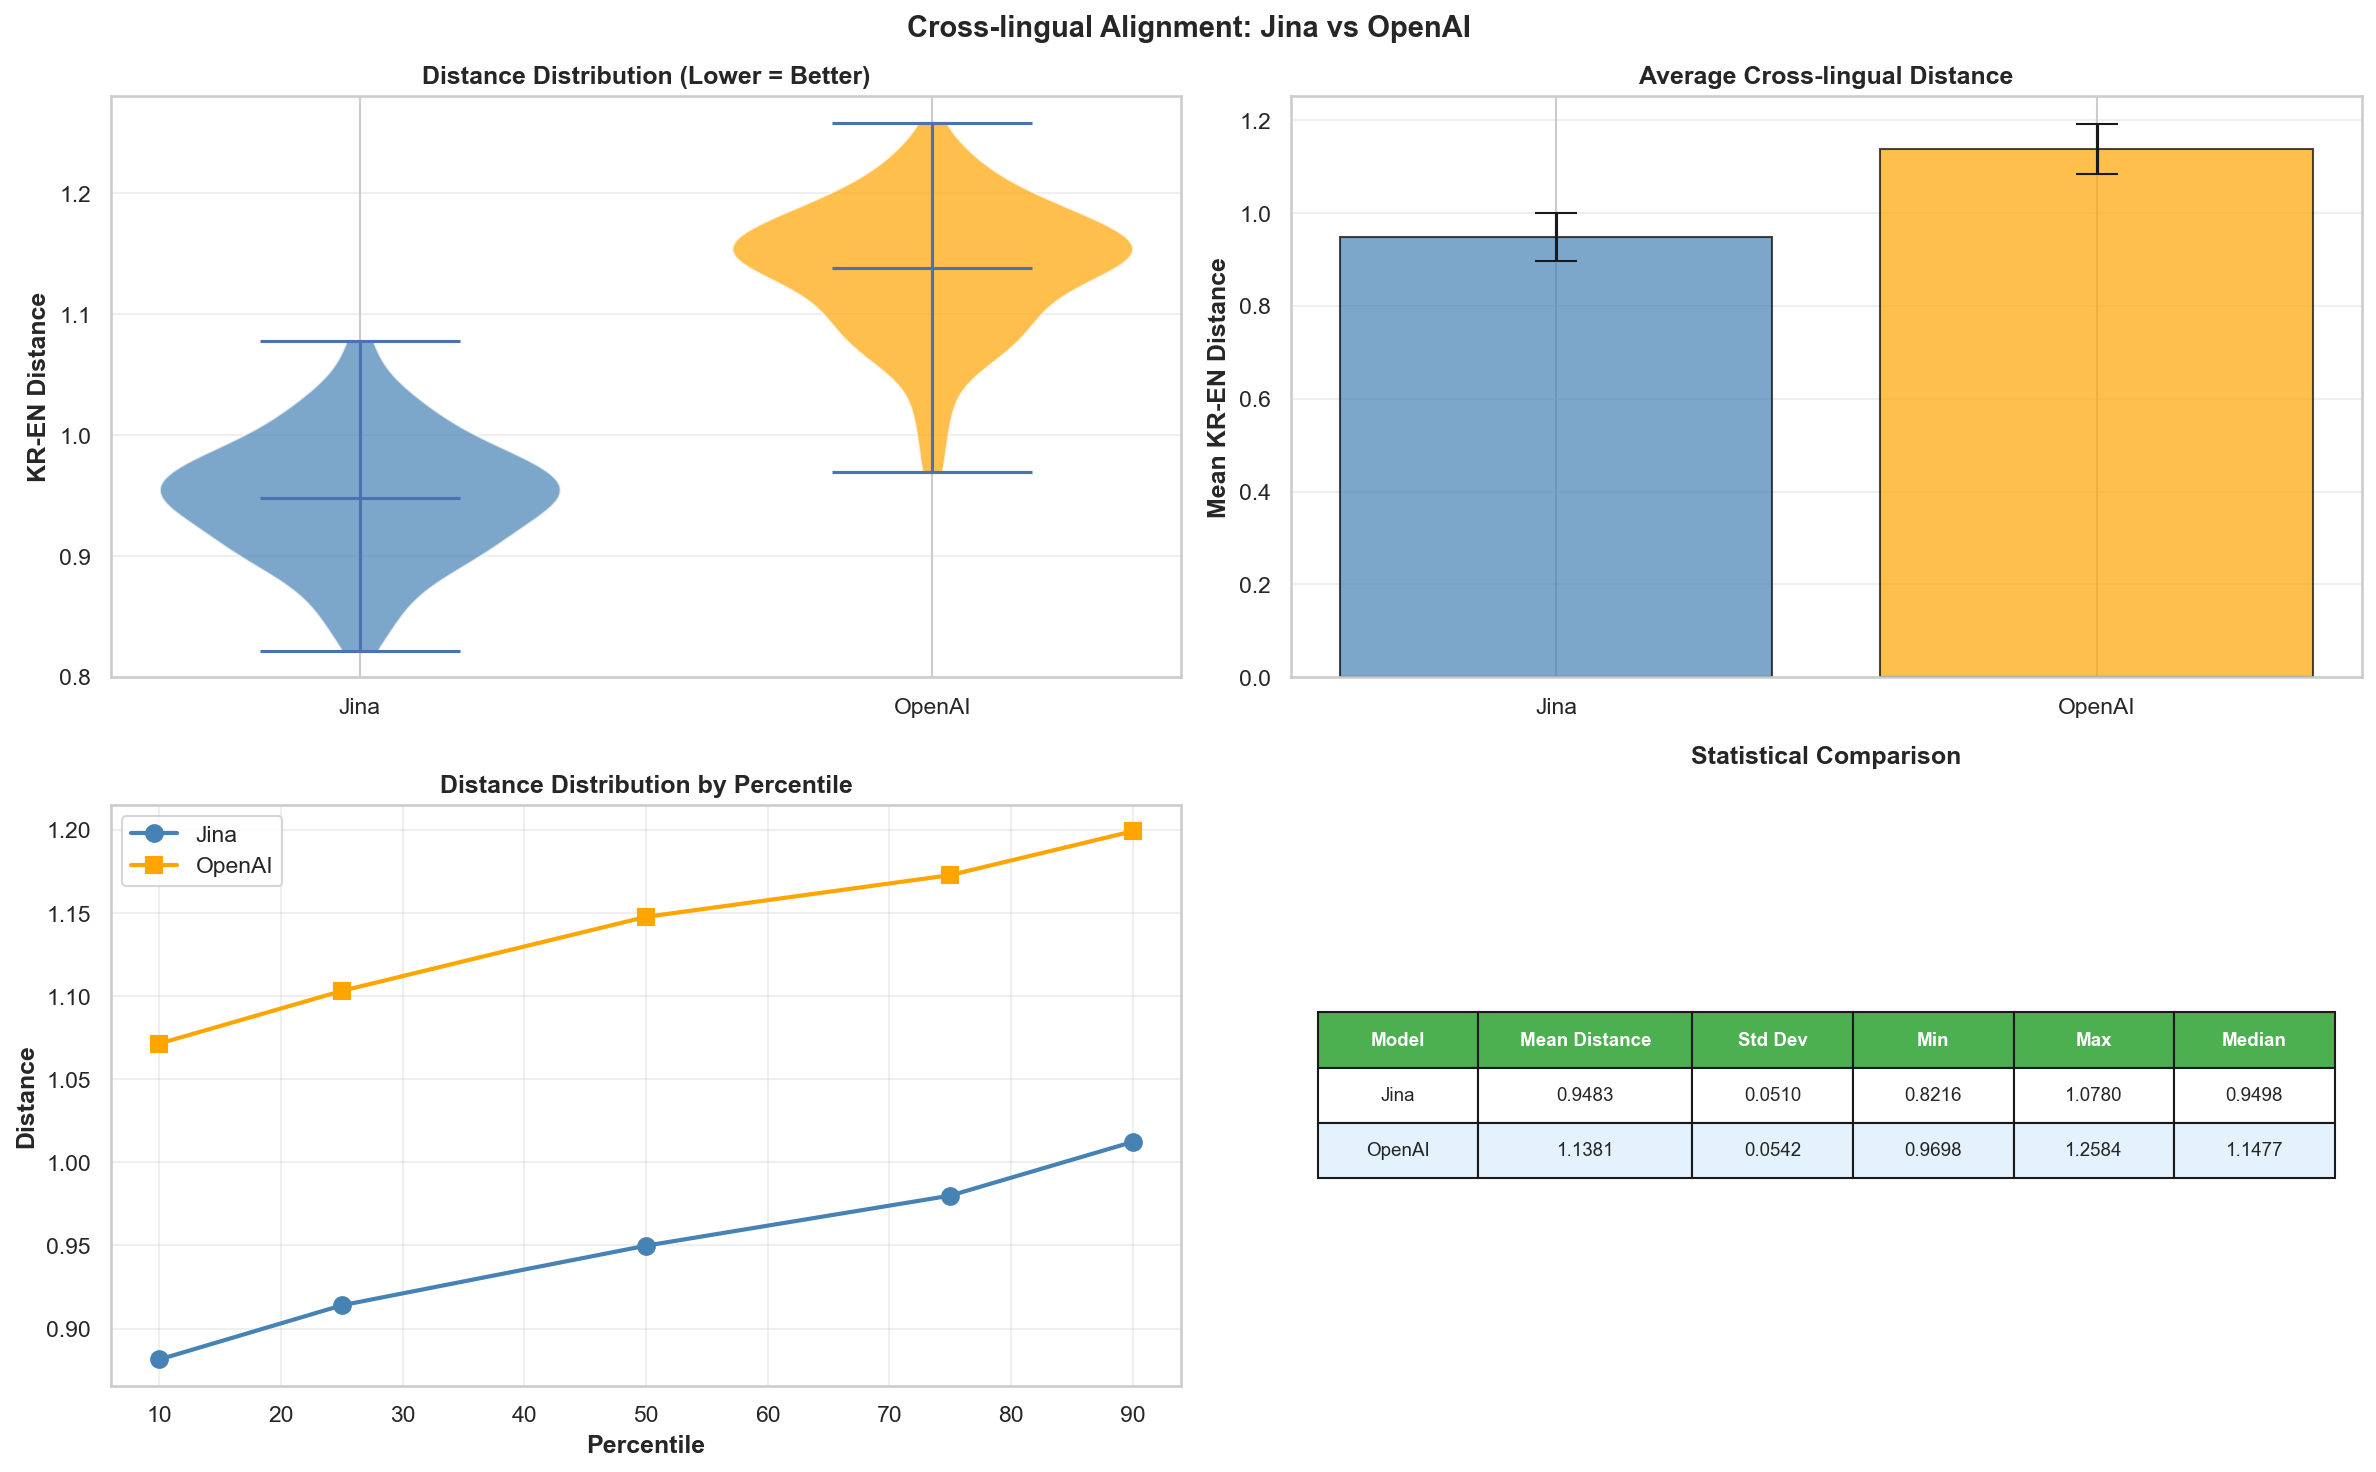
[4] Cross-lingual Alignment
Jina v3 vs OpenAI text-embedding-3-small
Based on the preprocessing and analysis above, I compared the performance difference between Jina v3 and OpenAI text-embedding-3-small.
The OpenAI model showed better overall performance, so I decided to use the OpenAI model for future app development.
Conclusion and Next Steps
Through this embedding model comparison and data preprocessing analysis, I reached the following conclusions:
- OpenAI text-embedding-3-small performs better than Jina v3.
- The preprocessing process has a large impact on embedding quality.
- Excessive refinement in the Refined stage can actually lower performance.
For now, I plan to remove the logical skeleton from the refined stage, align both datasets into the same format, and run the benchmark again.
[Algorithm Type] {Algorithm Name}
[Problem Summary] {Core logic description}
[Complexity] Time: {Time}, Space: {Space}
댓글